
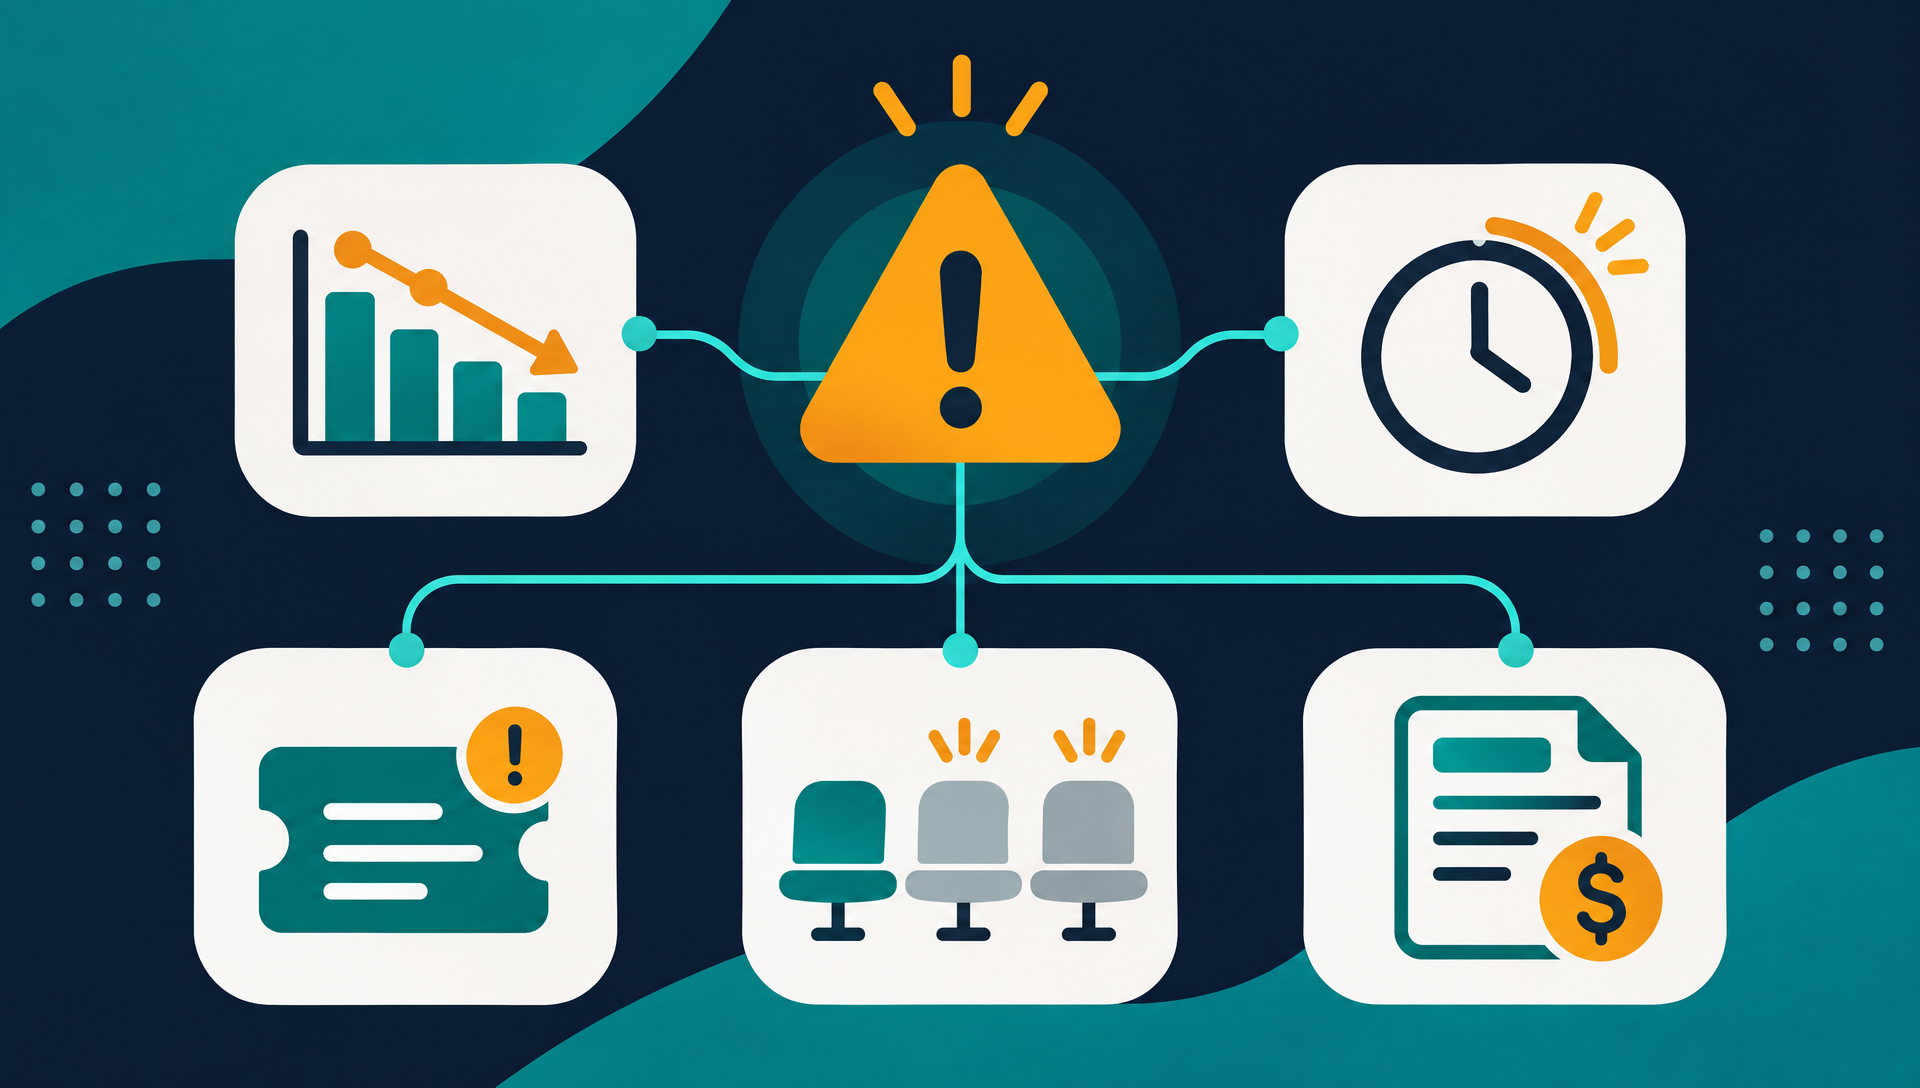
A customer cancels, and the post-mortem reveals warning signs that were visible for weeks. Login frequency dropped. Support tickets went unanswered. The champion left. The signals were there, but nobody was watching them together.
This article breaks down five leading indicators of churn that B2B SaaS teams can track today. Each one points to a specific type of disengagement, and each one gives you a window to act before the cancellation email arrives.
Key takeaways
- The strongest leading indicators of churn combine usage data, billing signals and relationship changes rather than relying on any single metric.
- Most churn signals appear four to eight weeks before cancellation, which means weekly monitoring catches problems monthly reviews miss.
- Tracking these indicators manually does not scale past a few dozen accounts. Automated health scoring turns scattered signals into a single prioritized view.
What makes an indicator “leading” instead of “lagging”
A lagging indicator tells you what already happened. Monthly churn rate, logo retention and net revenue retention are lagging: by the time they move, the customer is gone. A leading indicator of churn is a behavioral or contextual signal that changes before cancellation, giving you time to respond.
The distinction matters because it determines whether your team is reacting or preventing. If the only metric on your CS dashboard is churn rate, you are always looking backward. Leading indicators flip that around. They tell you where to focus this week, not what you lost last month.
The five indicators below cover product engagement, support patterns, commercial signals, stakeholder changes and contractual timing. Individually, each one raises a flag. Together, they form a composite picture of account health that is far more reliable than any single data point.
1. Declining product usage
Usage is the most direct signal of value delivery. When an account’s active users, session frequency or feature adoption starts dropping, the product is becoming less central to their workflow. That shift usually happens gradually, not overnight, which is why a weekly trend matters more than a snapshot.
Watch for three specific patterns. First, a drop in daily or weekly active users relative to total seats. If an account is paying for 50 seats but only 12 logged in this week, the per-seat value argument is harder for their champion to defend at renewal. Second, declining depth of engagement: the account still logs in, but they have stopped using the features that drove adoption in the first place. Third, a sudden drop after a period of steady use, which often correlates with an internal decision or a competing evaluation.
Usage data typically comes from your product analytics tool (Segment, Amplitude, Mixpanel) or your own event pipeline. The challenge is not collecting it. The challenge is surfacing the decline in a way your CS team actually sees. A dashboard nobody checks is the same as no dashboard at all.
2. Support ticket patterns that signal frustration
Support data contains more churn signal than most teams realize. Two patterns matter: escalation and silence.
Escalation looks like a cluster of tickets in a short window, repeated contacts on the same issue, or tickets that move from a user to a manager to an executive. When the person filing tickets changes from an end user to a VP, the account is not just frustrated. They are evaluating whether to stay.
Silence is the opposite pattern and equally dangerous. An account that used to open tickets regularly and then stops may not have solved their problems. They may have stopped trying. A drop in support engagement combined with a drop in product usage is a strong churn signal.
Support data lives in tools like Zendesk, Intercom or HubSpot Service Hub. The useful metric is not “number of tickets” in isolation but the trend and the tone. A spike followed by silence is worse than a steady stream of feature requests.
3. Contraction and billing downgrades
When a customer reduces seats, downgrades to a lower plan or removes an add-on, they are telling you something concrete: the value they are getting no longer justifies the price they are paying. Contraction is not always a precursor to churn, but it raises the probability significantly.
Billing data from Stripe, Chargebee or your own subscription system shows these changes in real time. The signal to watch is the direction and the pace. One seat reduction on a 200-seat account is noise. Going from 200 seats to 80 over two months is a clear trajectory.
Contraction also changes the renewal math. A smaller contract is easier for the customer to walk away from and harder for your team to justify the same level of attention. Catching contraction early lets you have a value conversation before the account shrinks to a size where churn is the path of least resistance.
Track these indicators automatically
Veermo combines usage, billing and support signals into a single health score per account and sends alerts when risk levels change, so your team sees leading indicators without building spreadsheets.
4. Champion or stakeholder departure
Every B2B account has a champion: the person who chose your product, defended it internally and knows how to use it. When that person leaves the company, the account’s risk profile changes immediately. The new stakeholder inherits a tool they did not choose, may not understand and might already have a preference for something else.
Champion departure is one of the hardest leading indicators to detect automatically. Some teams track it through CRM contact changes, LinkedIn alerts or changes in the primary login. Others catch it indirectly: a new user suddenly has admin access, or the main point of contact stops responding to emails.
The window after a champion leaves is critical. Reaching out to the new stakeholder within the first two weeks, offering a fresh onboarding session and making a clear value case resets the relationship before the new person starts their own vendor evaluation. Waiting until renewal to discover the champion left three months ago is too late.
5. Renewal timing and contract gaps
Renewal timing is a structural indicator. An account on a monthly plan can leave at any time with minimal friction. An annual contract gives you a known deadline, but only if you are watching it. The risk is highest when an account is within 90 days of renewal and shows any of the other indicators above.
Contract gaps matter too. If an account’s renewal date passes without a signed renewal or an explicit extension, the account is already in a decision phase. Some customers let contracts lapse into month-to-month as a step toward cancellation. Others are simply busy and need a nudge. Either way, the gap itself is a signal worth tracking.
The most useful view combines renewal timing with health data. An account renewing in 60 days with a strong health score needs a different conversation than one renewing in 60 days with declining usage and a recent seat reduction. Without that combined view, every renewal gets the same generic outreach.
How the five indicators work together
No single indicator is a reliable predictor on its own. Usage drops can be seasonal. Support silence can mean the product is working perfectly. Contraction can reflect a legitimate business downturn unrelated to your product. The power is in the combination.
| Indicator | Primary data source | Typical lead time | Urgency when combined with others |
|---|---|---|---|
| Declining product usage | Product analytics (Segment, Amplitude) | 4–8 weeks | High if paired with contraction or renewal proximity |
| Support ticket patterns | Helpdesk (Zendesk, Intercom) | 3–6 weeks | High if escalation followed by silence |
| Contraction and downgrades | Billing (Stripe, Chargebee) | 4–12 weeks | Very high if combined with usage decline |
| Champion departure | CRM, login data, LinkedIn | 2–8 weeks | Critical if no new relationship is established |
| Renewal timing gaps | CRM, billing | 0–90 days | Highest risk when health is already low |
An account that shows two or more of these signals simultaneously is at materially higher risk than one showing a single flag. The practical question is how to monitor all five at once, across every account, without turning your CS team into full-time analysts.
This is where a composite health score becomes valuable. Instead of checking five dashboards, your team sees one number per account with the contributing factors visible underneath. When the score drops, the alert lands in Slack or email with the reason attached, and the CSM knows which signal moved and what conversation to have.
The goal is not to track more metrics. The goal is to see fewer, better signals that arrive early enough to change the outcome.
Start tracking leading indicators this week
You do not need a new tool to start. Open your product analytics and pull a list of accounts whose weekly active users dropped by more than 30% in the past month. Cross-reference that list with upcoming renewals in the next 90 days. The overlap is your highest-risk segment right now.
If that manual exercise surfaces accounts your team did not know about, it proves the case for automating the process. A tool like Veermo connects your billing, product and support data and runs this analysis continuously, surfacing the accounts that need attention before the cancellation decision is made.
Pick one indicator from this list, pull the data this week and share it with your CS team. That single step moves your retention strategy from reactive to proactive, and it takes less than an hour.