
Health scores
Know which accounts are healthy
and why they changed.
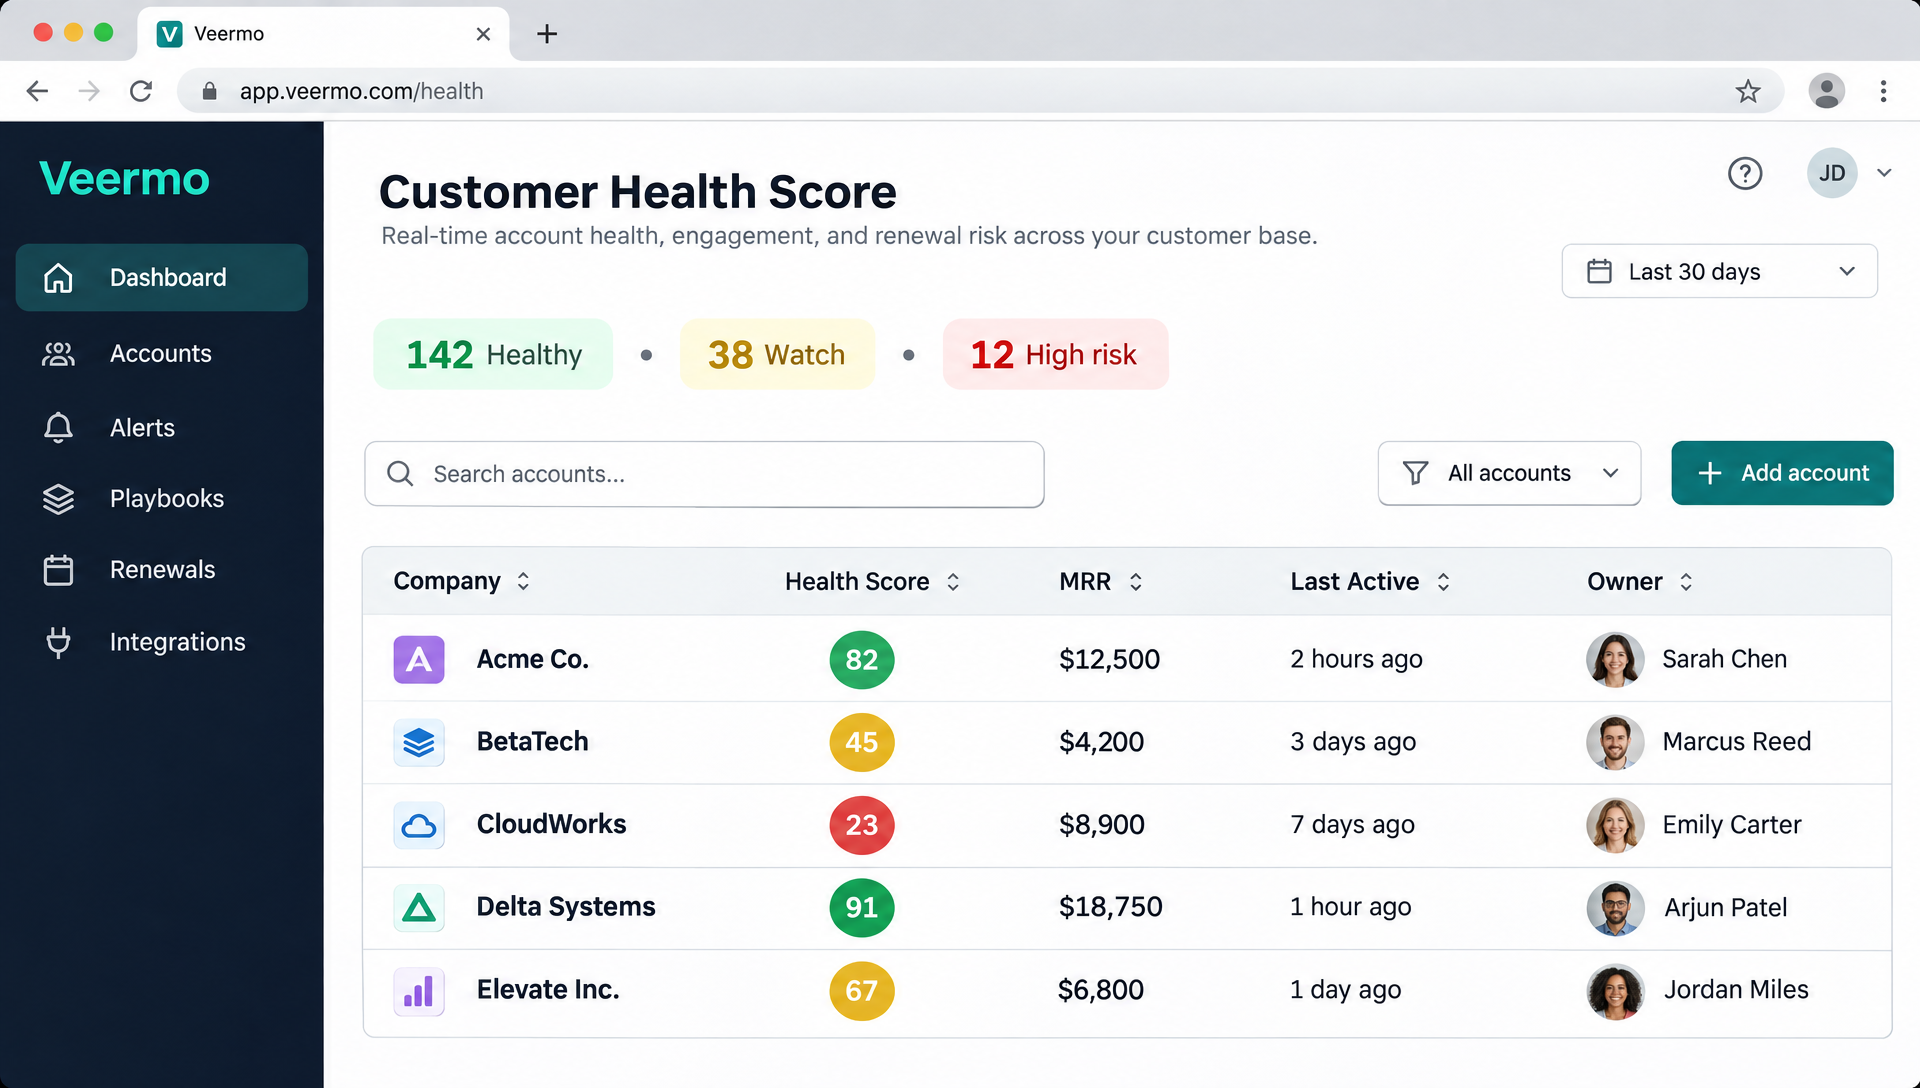
Most health scores tell you something is wrong but not what. Veermo combines product usage, seat activity, support signals and billing health into one score per account, and shows exactly which factors moved it, so your team acts on the cause instead of investigating.
5
Signal categories combined into one score
Daily
Automatic scoring with no manual work
3
Clear risk levels: Healthy, Watch, High
Transparent signals
Every score explains itself.
Open any account and see the exact factors behind its score: login frequency, feature adoption, support ticket volume, billing status and seat changes. When a score drops, your CSM knows whether the problem is usage, support or billing before they pick up the phone.
No black boxes. No “the model says so.” Every signal is visible, so your team trusts the score enough to act on it.
How it works
From raw data to an explainable score in four steps
- Connect your data sourcesLink billing, CRM, support and product analytics. Veermo backfills 12 months of history so scores start with context, not a blank slate.
- Signals are weighted automaticallyUsage trends, seat activity, support volume and billing health each contribute to the score. Weights adjust to your product’s patterns over time.
- Scores update every dayEach account gets a fresh score every morning. The dashboard shows which direction it moved and which signal drove the change.
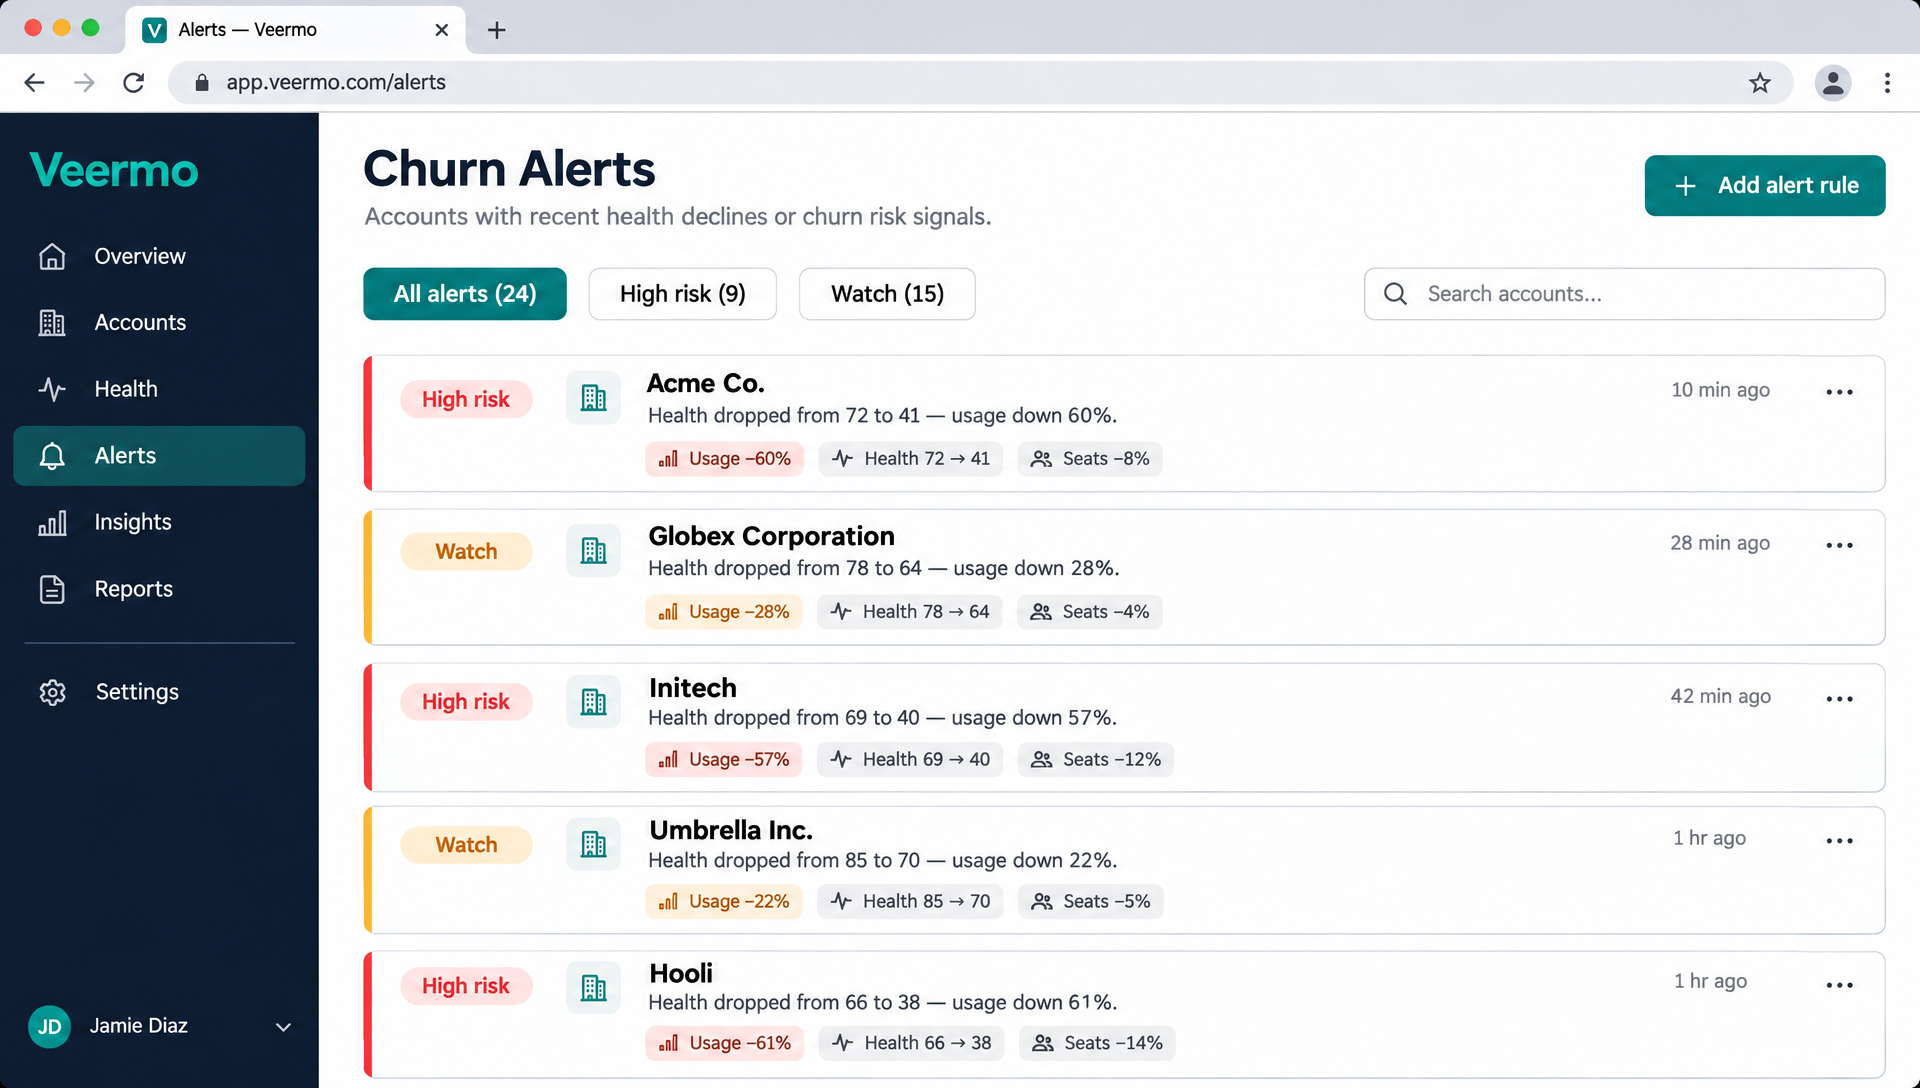
- Risk changes trigger alertsWhen an account crosses from Healthy to Watch or from Watch to High, the owner gets a Slack or email alert with the reason attached.
Risk levels
Three levels, no ambiguity.
Healthy means the account is active and on track. Usage is steady or growing, billing is current, support volume is normal.
Watch means one or more signals have started to decline. Usage may be dropping, or a key feature went unused for two weeks. Worth a check-in.
High means multiple warning signs are firing at once. This account needs attention now, and the score shows exactly where to start.
“We went from reactive check-ins to knowing exactly which accounts need attention every morning. Our save rate jumped from 15% to 41% in one quarter.”
Sarah Chen
VP Customer Success, Recurly
Works with the tools you have
Veermo reads data from Stripe, HubSpot, Salesforce, Segment, Intercom, Zendesk and Slack. Connect in a few clicks, no engineering sprint required. Scores start with 12 months of backfilled history.
FAQ
Health scoring questions
What data goes into a health score?
Veermo combines product usage, seat activity, support signals and billing health. You can start with just billing data from Stripe and add other sources over time.
Can I see why a score changed?
Yes. Every score shows the specific factors that moved it. If an account dropped because logins fell 40% this week, you see that directly on the account page.
How long before scores are useful?
Veermo backfills 12 months of history from your data sources on connection, so scores start meaningful from day one instead of needing weeks to calibrate.
What happens when a score changes risk level?
The account owner gets a Slack or email alert with the reason attached. You can also trigger a save playbook automatically when an account moves to High.
Stop guessing which accounts need attention.
Connect your data today and see explainable health scores across every account by tomorrow morning.