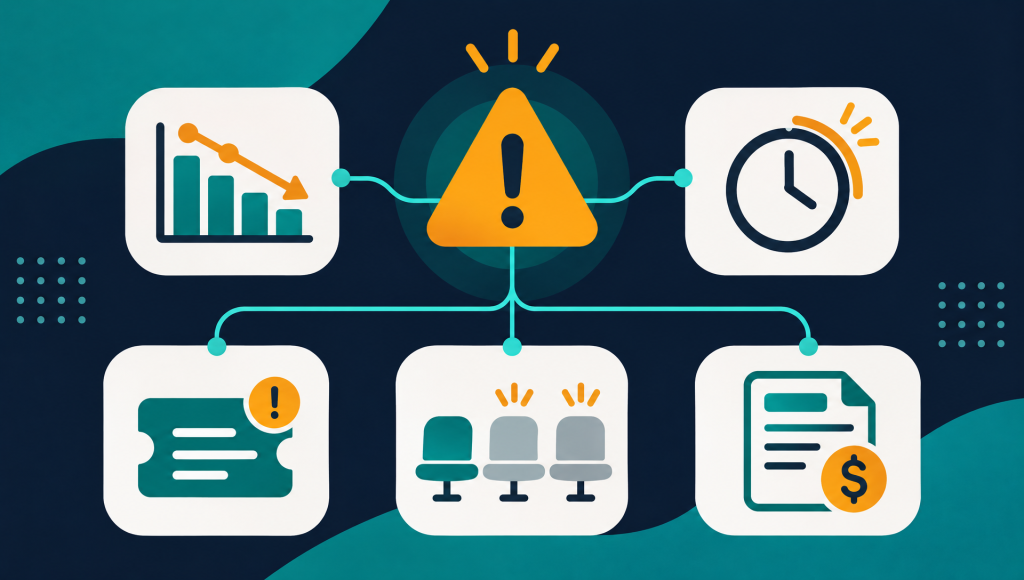

You have hundreds of accounts. Some are expanding. Some are coasting. Some are quietly disengaging, and you will not find out until the cancellation email lands. The problem is not a lack of data. It is that the data lives in six different tools and nobody is watching all of it at once.
A customer health score solves this by combining the signals that matter into a single number per account. This article explains what a customer health score is, which inputs to include, how to weight them, and how to turn the result into action your team can take this week.
Key takeaways
- A customer health score is a composite metric that ranks every account on a spectrum from healthy to at risk, using product usage, billing and support signals.
- The best health scores are transparent: the team can see which signals moved the score, not just the number itself.
- Health scores only reduce churn when they are tied to a workflow: an alert, an owner, and a next step.
What a customer health score actually measures
A customer health score is a single number, usually on a 0–100 scale, that represents how likely an account is to renew. It pulls from multiple data sources: how often users log in, which features they use, whether they are paying on time, how many support tickets they file, and whether their seat count is growing or shrinking.
The concept borrows from credit scoring. A credit score does not tell you why someone might default. It tells you the probability, and it does so by combining dozens of signals into a single, comparable number. A customer health score does the same thing for retention.
In practice, most SaaS companies group their accounts into three or four tiers based on the score: Healthy, Watch, and High risk. The labels matter less than having a shared language. When a CSM says “this account moved to Watch,” everyone on the team knows what that means and what happens next.
Veermo’s health score follows this model: every account is scored daily, and the factors that moved the score are shown alongside the number so the team knows what changed and why.
The five inputs that matter most
Not every signal carries the same weight. A missed invoice payment is a stronger churn predictor than a dip in page views. The inputs below are listed roughly in order of predictive strength for most B2B SaaS products.
| Signal category | What to measure | Why it matters |
|---|---|---|
| Product usage | Daily or weekly active users, feature adoption depth, session frequency | Usage is the closest proxy for value delivered. When usage drops, the customer is getting less from the product. |
| Billing health | Payment failures, downgrades, discount requests, days past due | Billing actions are high-intent signals. A downgrade is a deliberate decision, not noise. |
| Support activity | Ticket volume, ticket severity, time to resolution, repeat issues | A spike in tickets can mean friction. A sudden silence after heavy support usage can mean the customer gave up. |
| Engagement | Email open rates, event attendance, NPS or CSAT responses | Low engagement with your team suggests the relationship is cooling, even if usage looks stable. |
| Contract and expansion | Seat count trend, add-on adoption, renewal date proximity | Growing accounts rarely churn. Shrinking accounts are contracting before they cancel. |
You do not need all five from day one. Billing data from Stripe and basic product usage are enough to start scoring. The score gets more accurate as you add signals over time.
How to weight the signals
Weighting is where most health score projects stall. Teams spend months debating whether a support ticket should count for 10% or 15%, and the score never ships.
A better approach: start with equal weights, launch the score, then adjust based on which signals actually correlated with churn in your data over the next quarter. Retroactive analysis beats theoretical modeling.
Here is a reasonable starting framework for a B2B SaaS product:
- Product usage: 35%. This is the foundation. If users are not logging in and using core features, no amount of good billing or support data will save the account.
- Billing health: 25%. Failed payments, downgrades and discount requests are strong leading indicators.
- Support activity: 20%. Watch for both spikes (frustration) and sudden drops (giving up).
- Engagement: 10%. Useful as a secondary signal, but noisy on its own.
- Contract signals: 10%. Seat trends and renewal proximity add context to the other categories.
These weights are starting points. Your product and customer base will shift them. The important thing is to launch with something defensible and iterate.
Skip the spreadsheet. See health scores today.
Veermo calculates a daily health score for every account using your existing billing, product and support data, with the factors that moved each score shown transparently.
The transparency problem: why black-box scores fail
A health score is only useful if the person acting on it understands why the number changed. When a CSM sees an account drop from 78 to 52, the first question is always “what happened?” If the score is a black box, the CSM has to open five tabs and investigate manually, which defeats the purpose.
The best health scores show the contributing factors alongside the number. Something like: “Score dropped 26 points. Primary drivers: daily active users fell 60% over two weeks, two support tickets marked urgent, and the billing contact requested a downgrade quote.”
This transparency serves two purposes. First, it gives the CSM a starting point for their outreach. They know what to mention and what to ask about. Second, it builds trust in the score itself. When the team can verify that the number reflects reality, they use it. When they cannot, they ignore it and go back to gut feel.
Connecting the score to a workflow
A health score without a workflow is a dashboard nobody checks. The score needs to trigger something: an alert, a task, a playbook. Otherwise it sits in a tab alongside all the other dashboards competing for your team’s attention.
Here is how customer success teams typically wire health scores into their daily work:
- Threshold alerts. When an account drops below a certain score, the account owner gets a Slack message or email with the score change and the reasons behind it. No dashboard checking required.
- Tiered response. Accounts that move to Watch get a check-in call within 48 hours. Accounts that move to High get an escalation to the CS lead and a save playbook triggered automatically.
- Renewal prep. Ninety days before renewal, the account’s health trajectory is reviewed. Accounts trending down get early intervention instead of a last-minute scramble.
- Weekly reviews. The CS team meets weekly to review all accounts that changed tiers. The health score gives the meeting a structured agenda instead of anecdotes.
The pattern is the same in each case: the score changes, a notification fires, a human acts. The score does the watching so the team can focus on the doing.
Common mistakes when building a health score
Most health score projects fail not because the math is wrong, but because of process and adoption problems. Here are the ones that come up repeatedly:
Too many inputs too soon. Teams try to include every signal from the start and spend months on data plumbing before anyone sees a score. Start with billing and one usage metric. Add signals later.
No owner for the score. If nobody is responsible for reviewing the model’s accuracy quarterly, the weights drift out of date and the team loses trust. Assign an owner, even if it is just one person who checks whether last quarter’s “High risk” accounts actually churned.
Scoring accounts that are too new. An account in its first 30 days has not generated enough signal to score reliably. Most teams exclude accounts in onboarding and switch them to the standard model once they pass a usage milestone.
Ignoring the “healthy” tier. Teams focus on saving at-risk accounts and forget to study what makes healthy accounts healthy. Those patterns should feed back into onboarding and product decisions.
The goal of a health score is not prediction for its own sake. It is giving your team a reason to act before the customer has decided to leave.
Start scoring this week
You do not need a data science team or a six-month project to get a working customer health score. Here is a practical path for this week:
- Pick two signals. Your billing system (Stripe, Chargebee, Recurly) already tracks payment status and plan changes. Your product likely tracks logins or core feature usage. Those two inputs are enough to start.
- Define three tiers. Healthy, Watch, High risk. Set the thresholds based on what feels right today. You will adjust them next quarter using actual churn data.
- Wire one alert. When an account moves from Healthy to Watch, send a Slack message to the account owner. One alert, one channel, one audience.
- Review after 30 days. Check which accounts that were flagged as Watch or High actually churned. Adjust weights accordingly.
If you want to skip the build and start with scores today, Veermo’s health scores connect to your existing tools and start scoring accounts the same day, with 12 months of backfilled history. No spreadsheet required.