
Revenue at risk
See the dollar value of churn
before it hits the P&L.
Veermo maps every at-risk account to its contract value and updates the total daily, so your retention number is always board-ready.
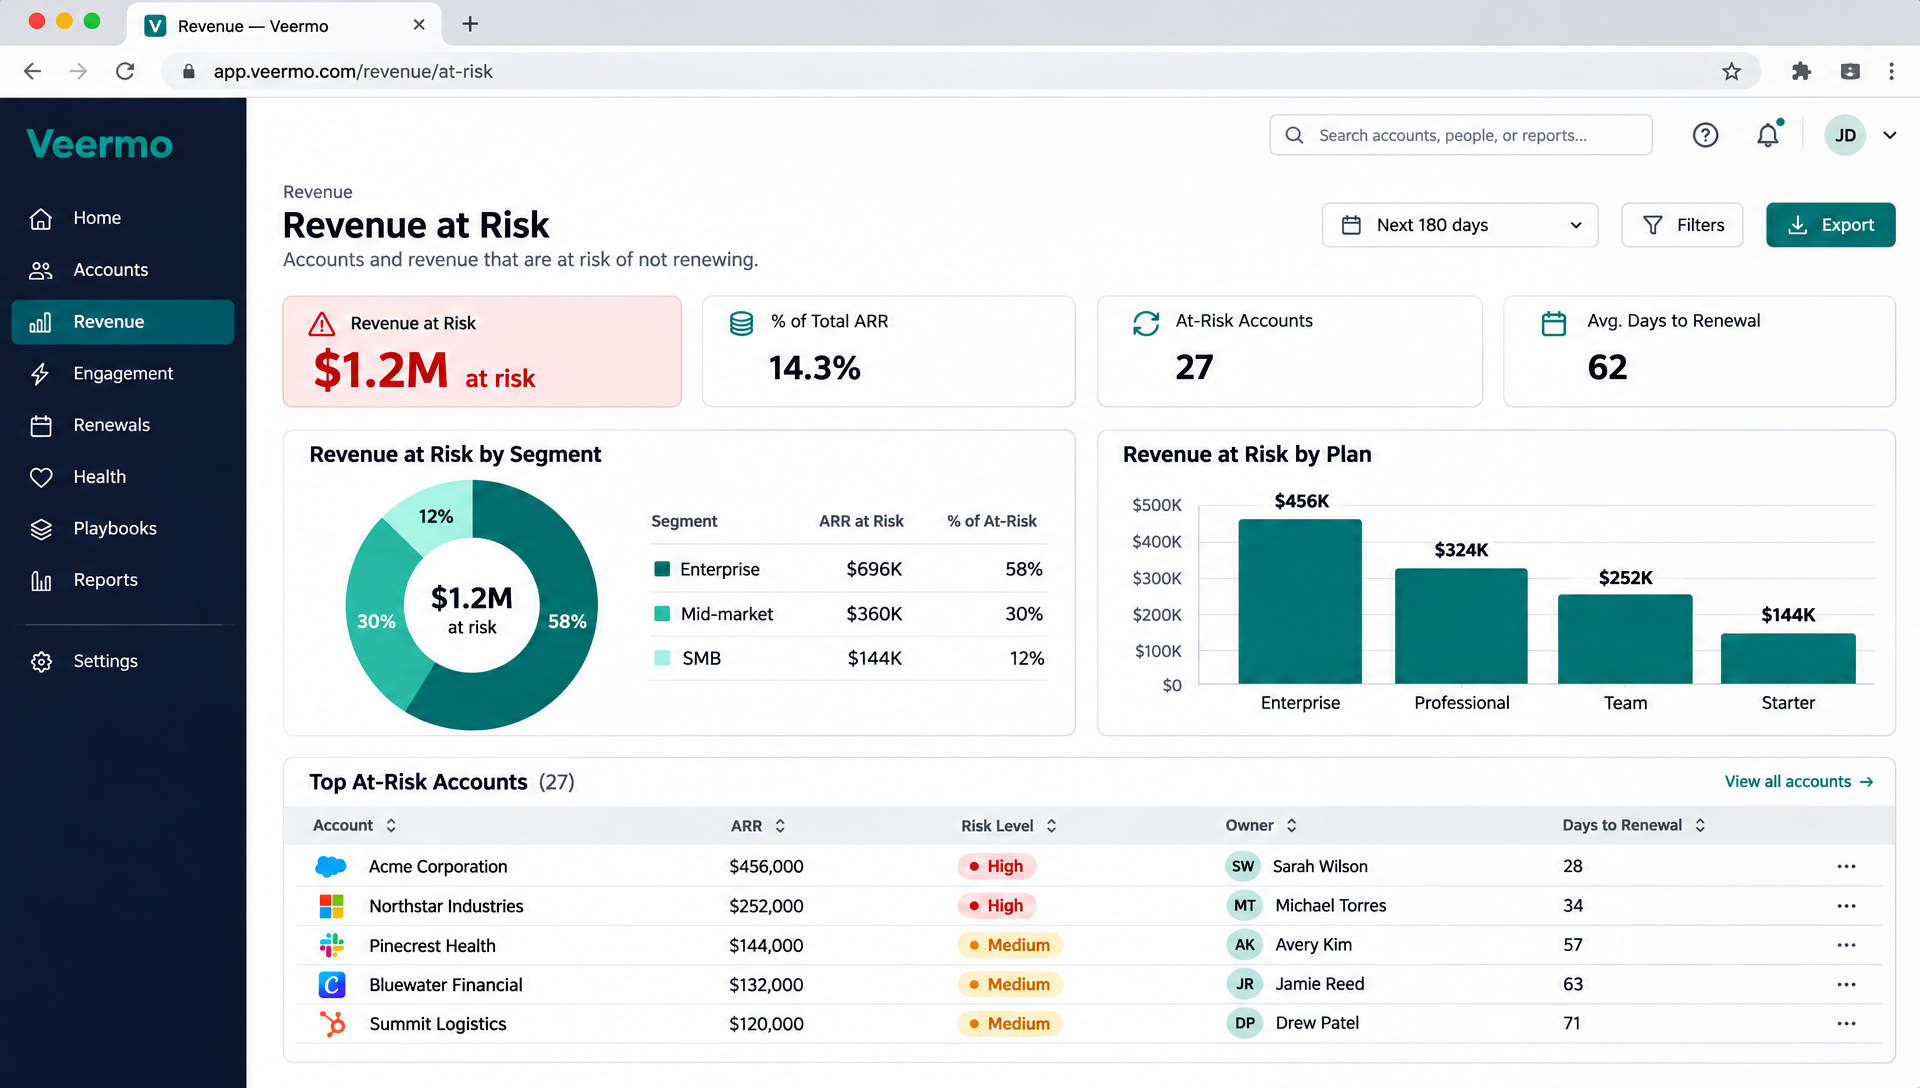
$1.2M
Total ARR at risk across all segments, updated daily
By segment
Enterprise, mid-market and SMB exposure in one view
By owner
Every CSM sees the revenue exposure in their own book
The dashboard
One screen that answers “how much revenue are we about to lose?”
Veermo pulls contract values from your billing source, maps them to daily health scores, and shows the result as a live revenue-at-risk number. No spreadsheets, no manual refresh, no stale data.
The view breaks down by segment, plan and account owner. Drill into any slice to see the accounts driving the number, or zoom out for the executive summary you share with your board.
What you can do with it
Turn a number into action.
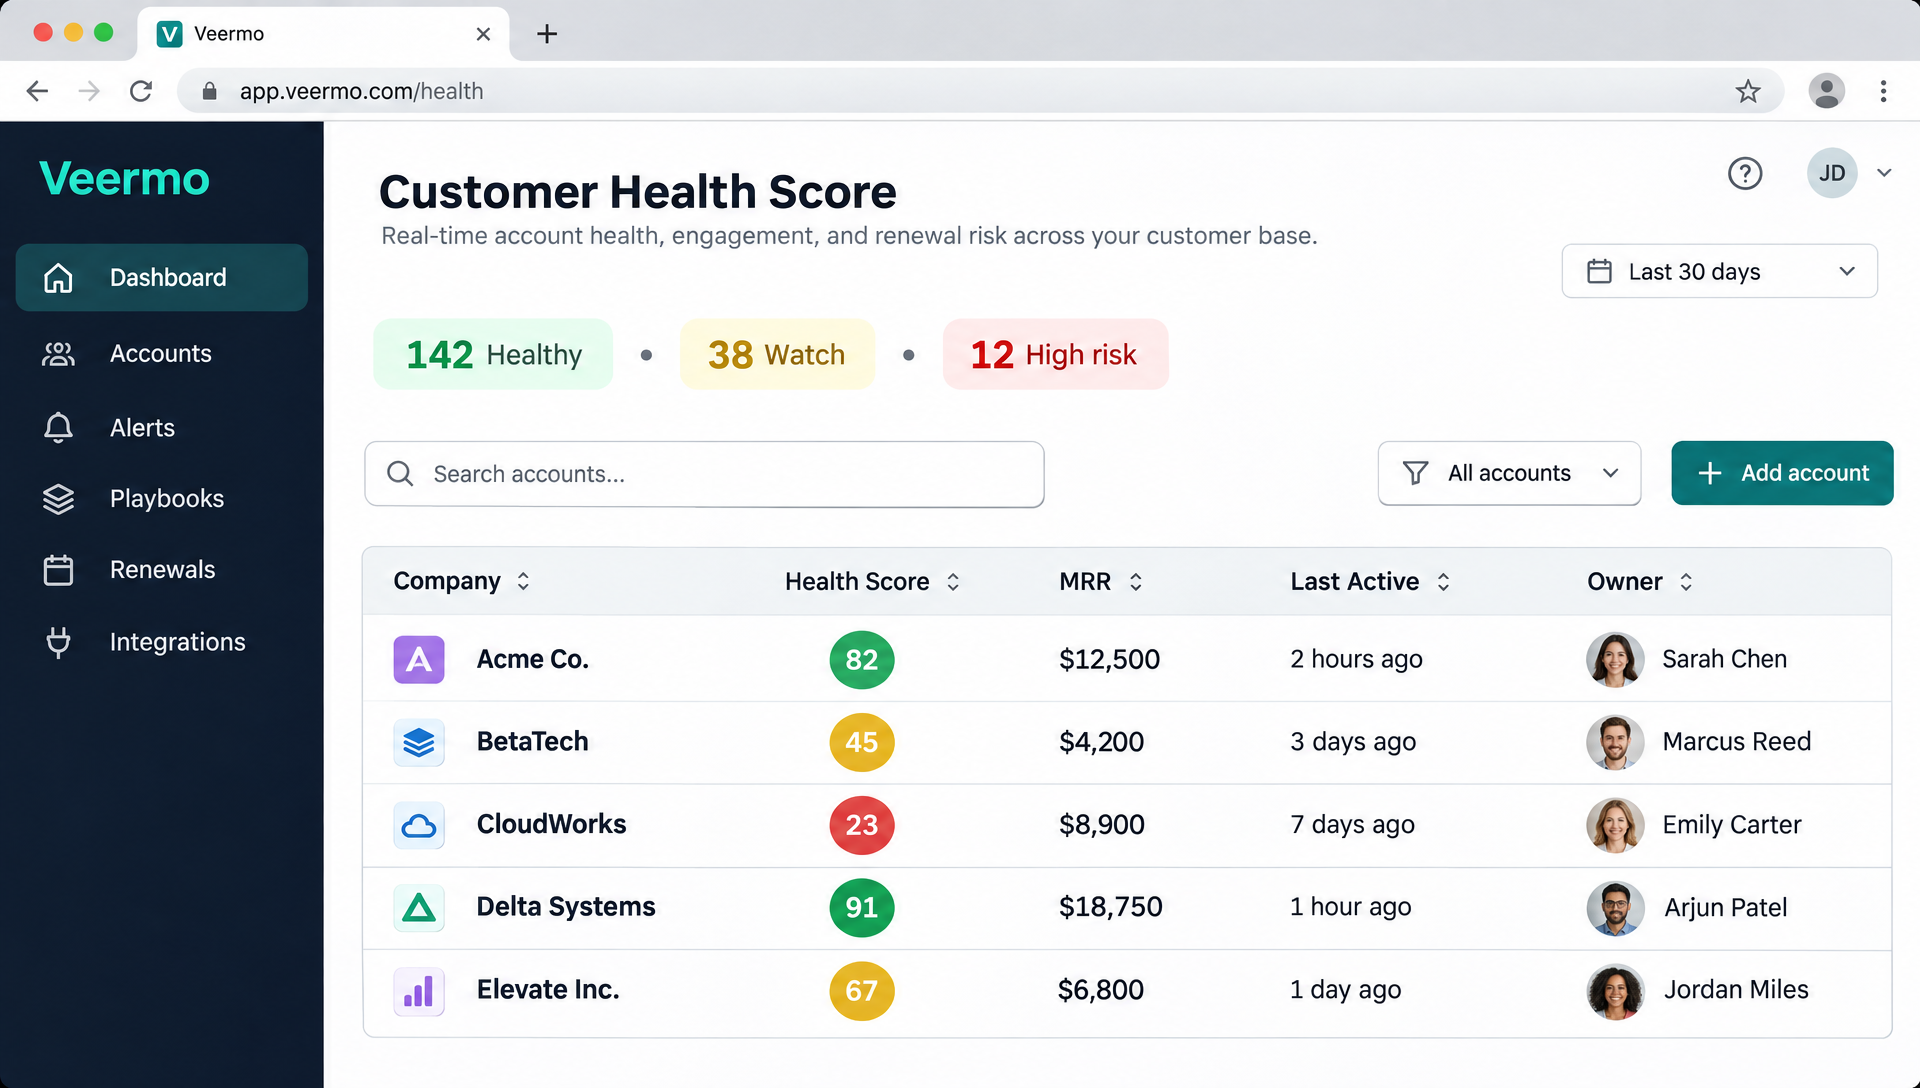
Prioritize saves by dollar impact
Sort at-risk accounts by ARR so your team focuses on the contracts that move the retention number most. A $50K save is worth more than five $2K saves.
Report retention to leadership in minutes
Share the live dashboard with your exec team or pull it up before a board meeting. Total exposure, trend over time and save rate, always current, no prep needed.
How it works
From raw data to a retention number in four steps.
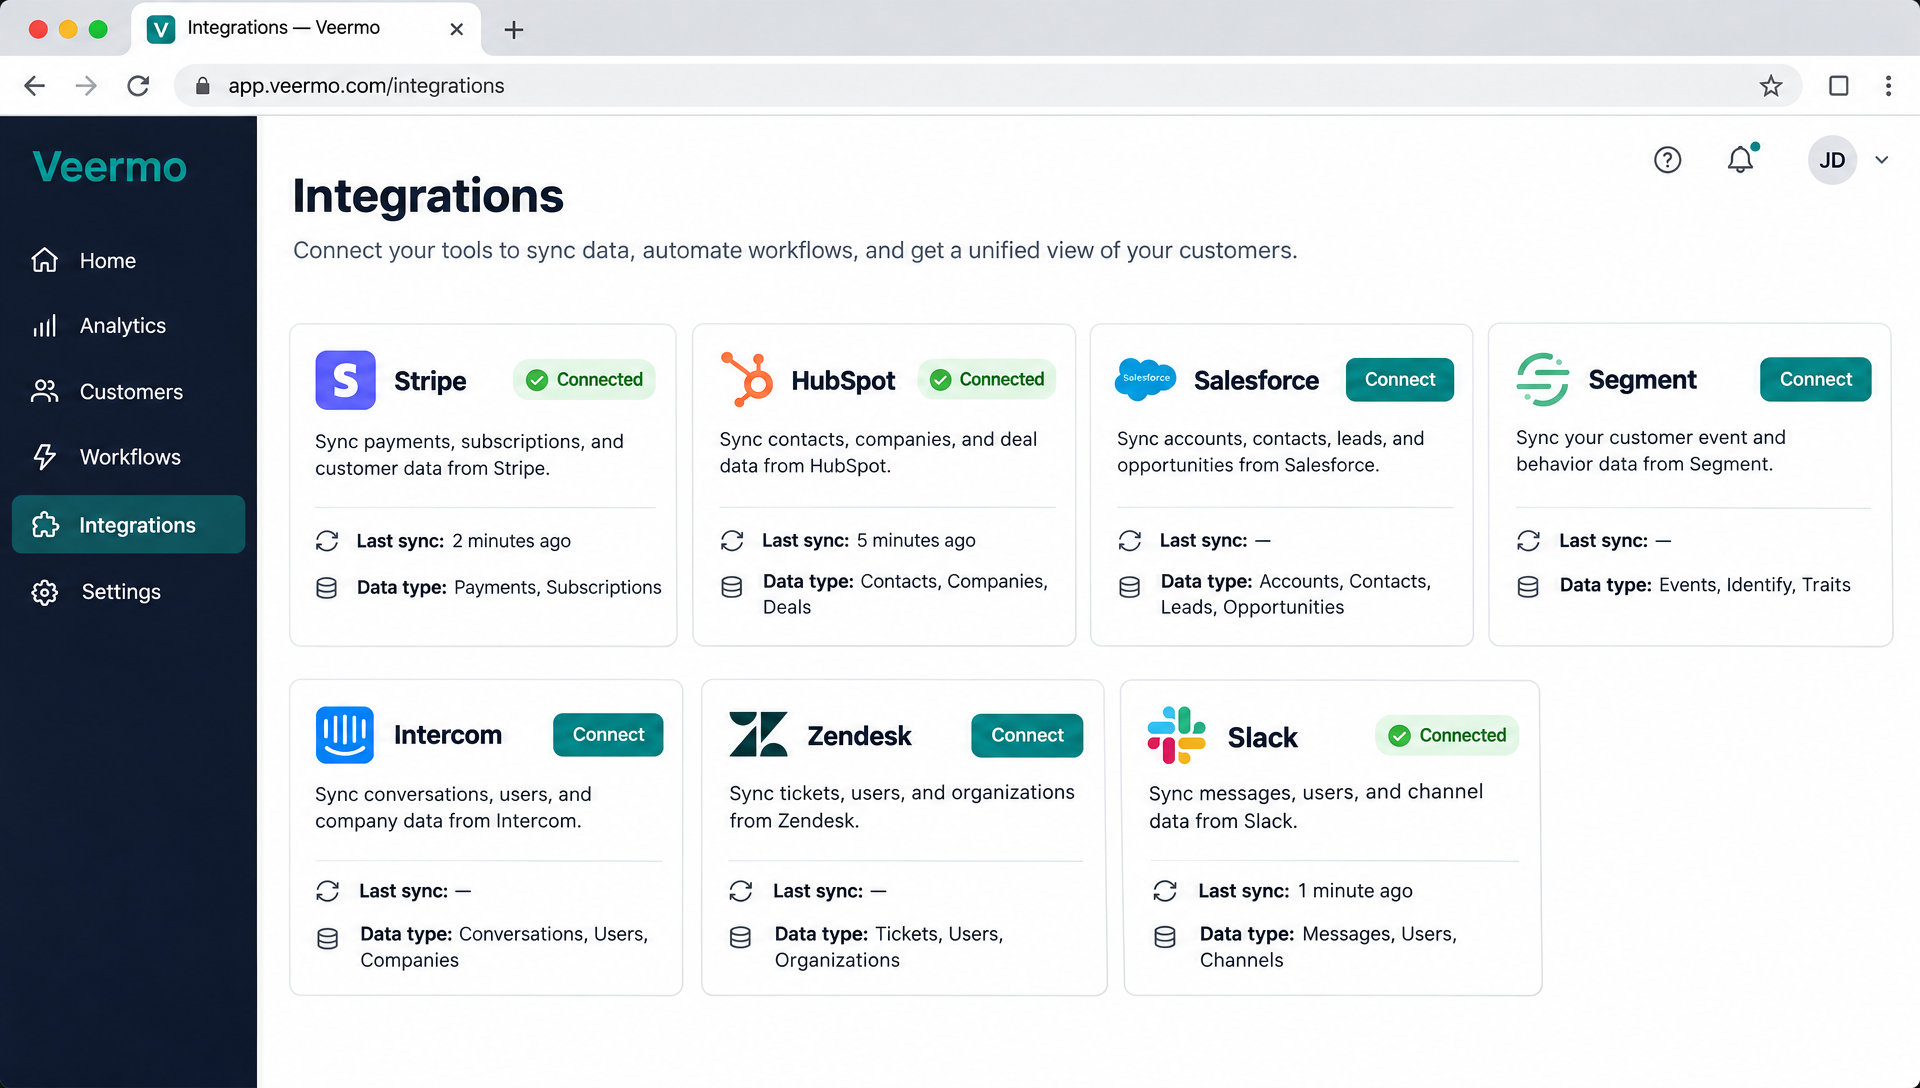
- Connect billingStripe, Chargebee or your billing source feeds contract values into Veermo automatically.
- Accounts are scoredDaily health scores combine usage, billing and support signals for every account.
- Revenue is mappedEach score is multiplied by the account’s ARR, giving every risk level a dollar figure.
- Exposure is groupedRevenue at risk rolls up by segment, plan and owner, updated every day.
“Board meetings used to mean two days of spreadsheet work. Now I pull up Veermo ten minutes before and have every retention number ready.”
Anna Lindberg
VP Revenue, Loom
Works with the rest of the platform
Revenue at risk connects to every other part of Veermo.
Health scores
The account-level scores that feed the revenue calculation. Transparent signals, updated daily.
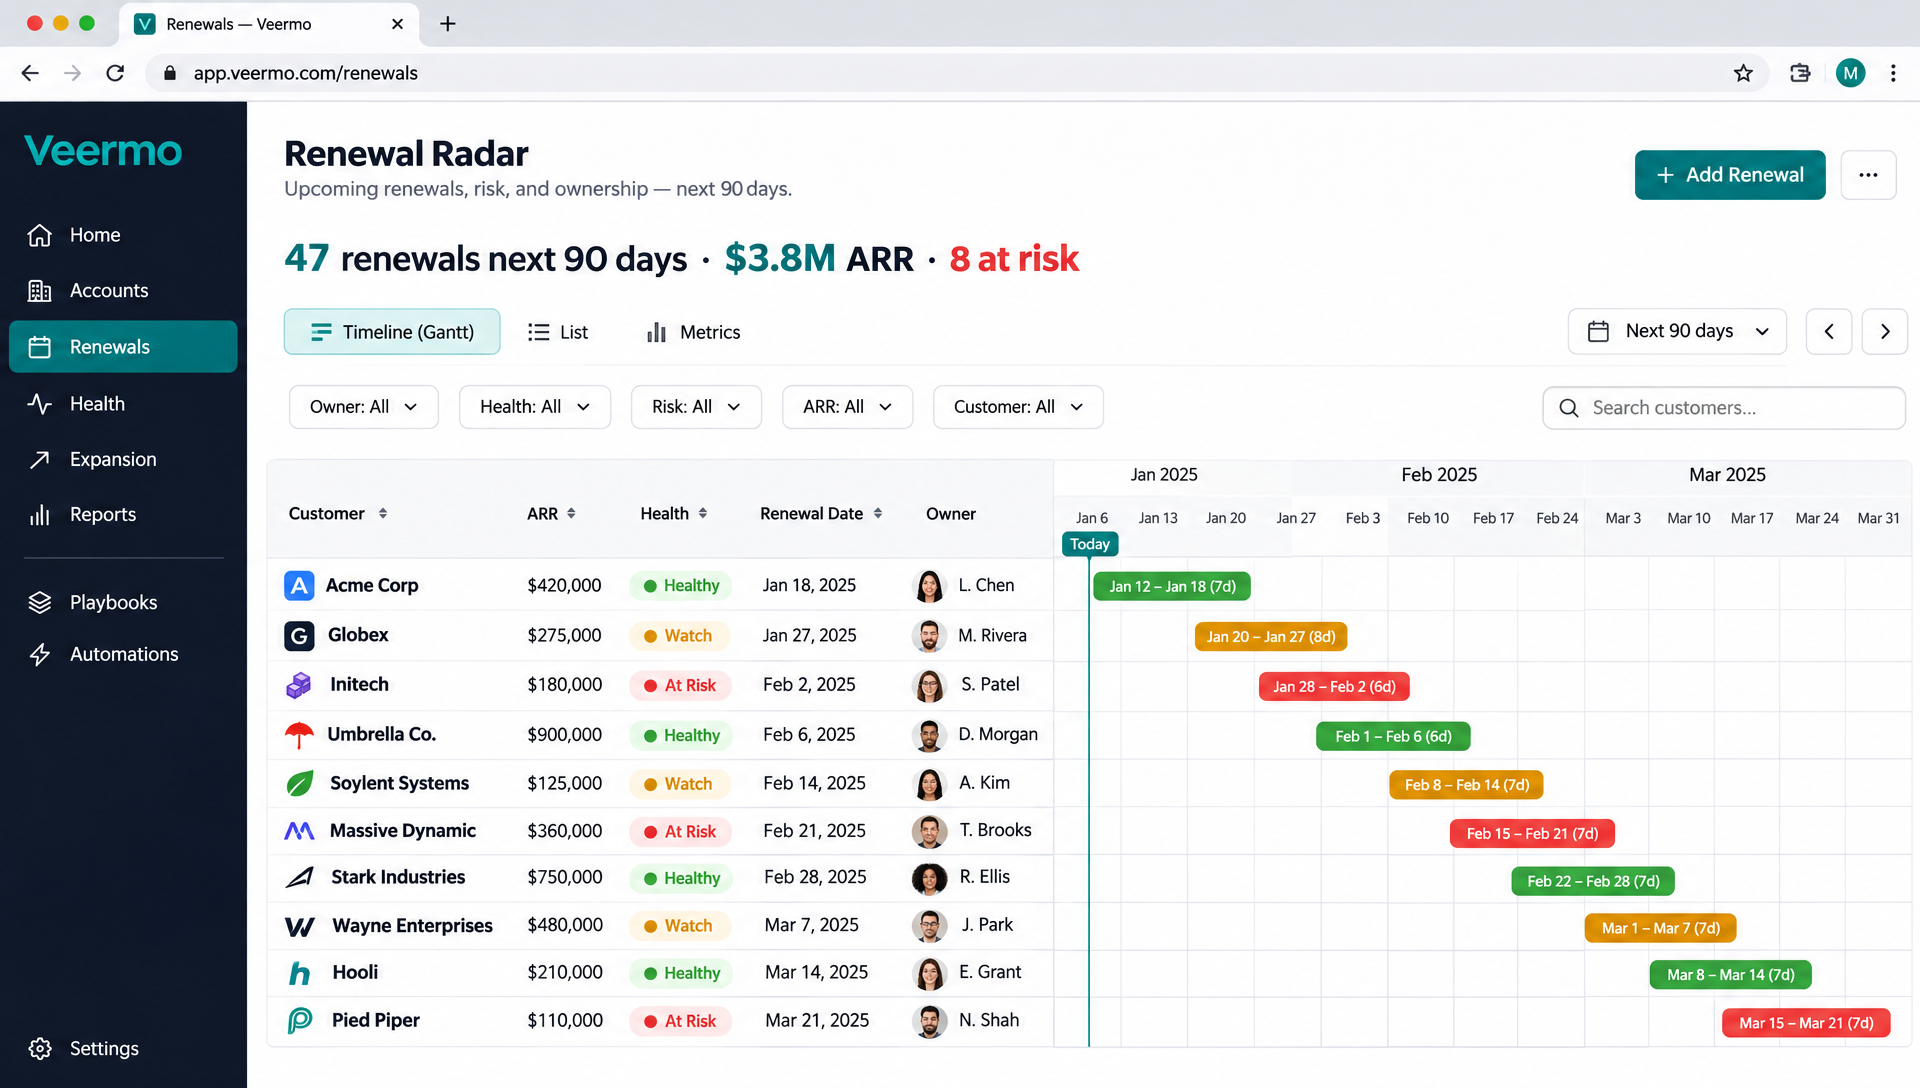
Renewal radar
Upcoming renewals ranked by risk and revenue, so your team prepares 90 days out.
Churn alerts
When a high-value account’s risk level changes, the owner hears about it in Slack or email.
Save playbooks
Trigger a timed save sequence the moment an account crosses a risk threshold.
FAQ
Questions about revenue-at-risk reporting
Where does the revenue data come from?
Veermo pulls contract values from your billing integration (Stripe or another connected source). It reads only; it never changes your billing records.
How often is revenue at risk updated?
Health scores update daily, and the revenue-at-risk view recalculates whenever scores change. You always see today’s picture, not last week’s export.
Can I break down exposure by custom segments?
Yes. You can group by plan, segment, owner or any account attribute your team tracks, and save the view for quick access.
How does this relate to renewal radar?
Revenue at risk shows total exposure across all accounts right now. Renewal radar focuses on upcoming renewals ranked by risk and revenue, so your team can prepare 90 days out.
Stop guessing how much revenue is at stake.
Connect your billing data and see your full exposure by segment, plan and owner by tomorrow morning.